
Characterize the culture broth
Assess cell density, viability, turbidity, and the effects of delays in harvesting.
Manage target product recovery and the load on downstream processes while reducing cells and cell debris.
Review selection pointsDiscuss this applicationReview product locations and fluid paths.
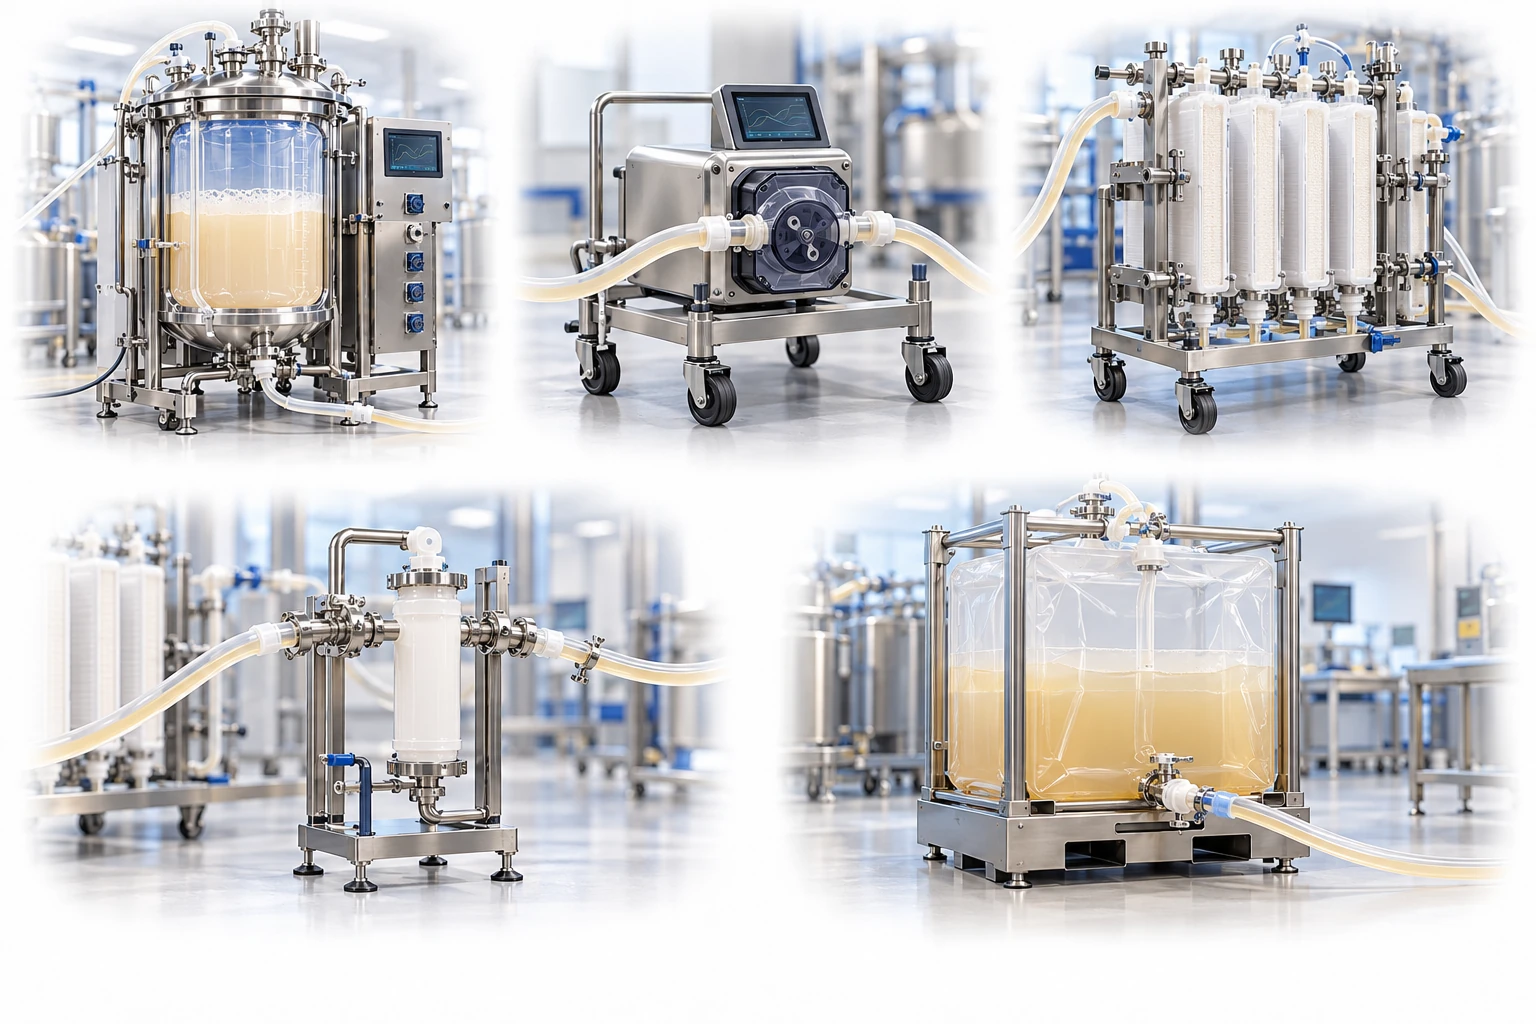
Evaluate particle removal and product recovery together. Clarification alone does not guarantee soluble-impurity removal.
A conceptual illustration created to explain equipment and application locations. It is not an actual product photograph, installation photograph or piping/wiring design.
Scroll horizontally to see the complete flow.
Consider centrifugation, filtration, or other methods for primary clarification. Compare impurity reduction by the depth medium with adsorption of the target product.
These conceptual views explain flow direction. Actual piping, wiring and physical flow rates require a separate design.
Define the intended use and conditions to identify the required role of each item.
Assess cell density, viability, turbidity, and the effects of delays in harvesting.
Compare combinations of centrifugation and staged depth filtration.
Evaluate fine particles, quality, and recovery before the fluid enters purification.
Changes in cell density and viability in the culture broth can change the capacity of the same filter. Assess not only the turbidity of the clarified fluid but also target product recovery, HCP and DNA levels, and the impact on downstream processes.
Scroll horizontally to review all columns.
| Process objective | Step to review | Selection evidence |
|---|---|---|
| Initial solids load | Harvest and primary clarification | Cell density, viability, and batch variability |
| Fine debris | Depth filtration / polishing | Turbidity, particle size, differential pressure, and capacity per unit area |
| Impurities | Adsorption characteristics of each medium | HCP and DNA reduction, and target protein loss through adsorption |
| Scale-up | Representative scale-down model | The same feed, filtrate flux, and loading conditions, plus liquid remaining in the piping |
These examples start the application review. Pore size or nominal rating alone does not establish suitability or retention; confirm with the actual process fluid and supplier evidence.
Even clear filtrate may contain soluble impurities and may be associated with product loss. Evaluate recovery together with impurity analyses.
Compare filters using feed that reflects actual variability, such as high cell density and low viability.
Account for variability and process endpoint criteria rather than directly scaling up the maximum capacity from a single small-scale test.
The contributions of particle removal and adsorption depend on the medium, feed, pH, and conductivity. Confirm them analytically and define their roles alongside downstream purification.
Vectors differ in adsorption behavior and losses of structure and activity, so separate assessments of recovery and function are required.
These details help narrow the configuration and the evidence to review.
May we use Google Analytics, Google Ads and ChatGPT Ads to measure visits and completed enquiries? Learn more