
Define the measurement question
Determine what to measure and which process decision the result will support.
Design contamination-resistant sampling together with representative measurement.
Review selection pointsDiscuss this applicationReview product locations and fluid paths.
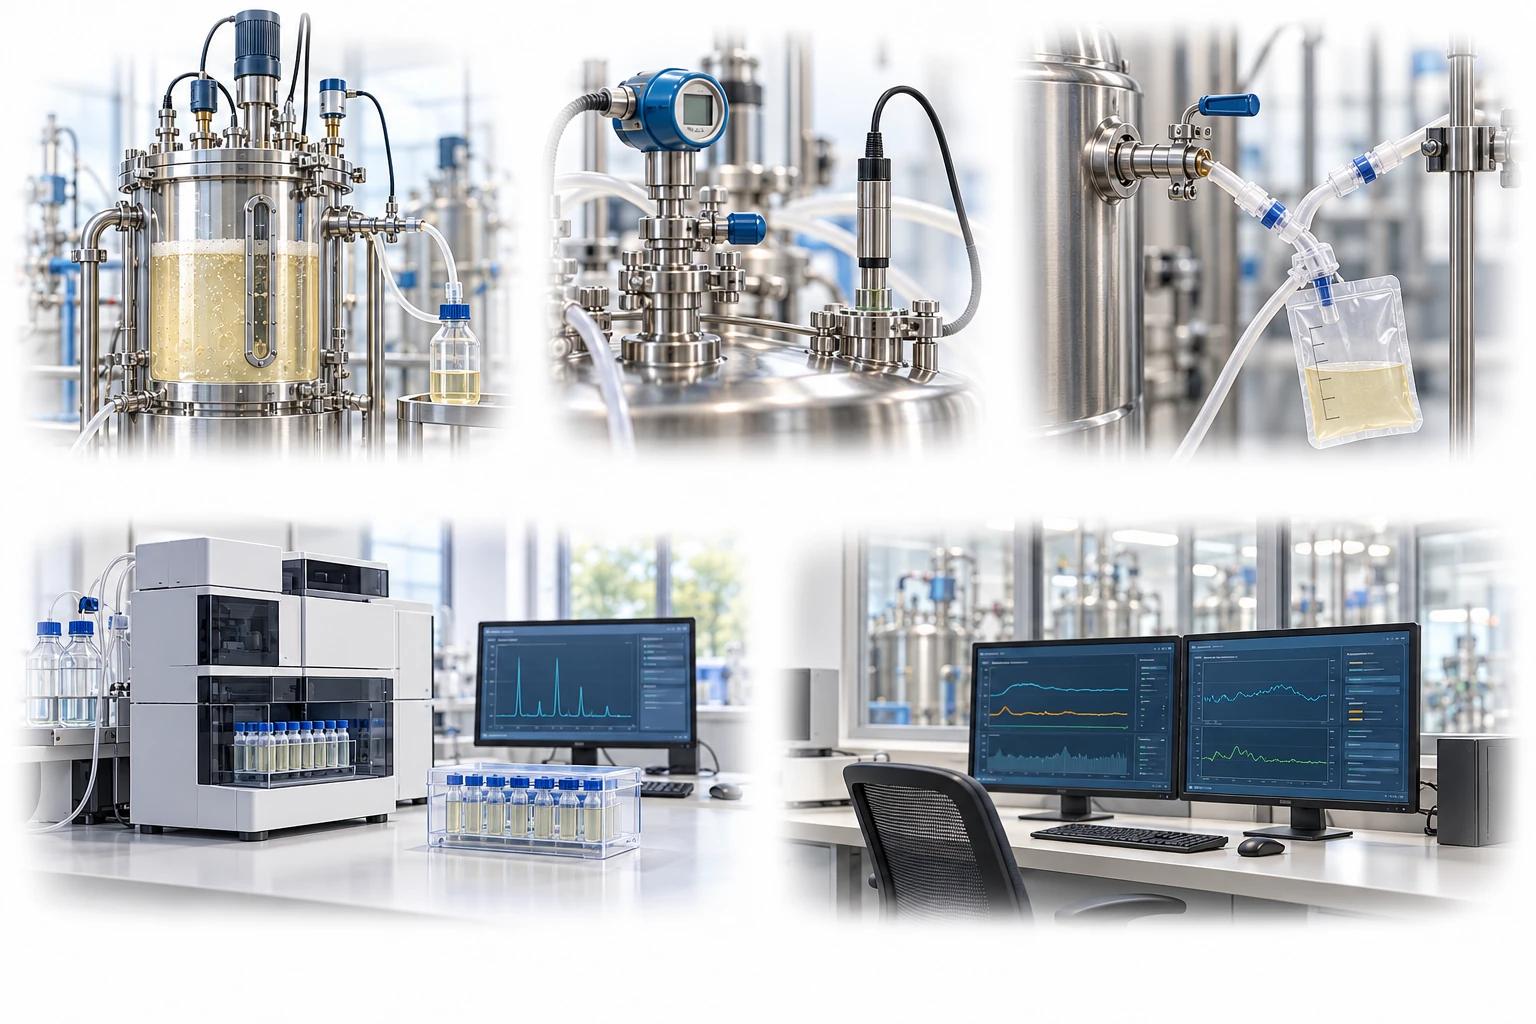
Sample-liquid paths and sensor signals are distinct. Record measurement location, calibration, sampling time and analysis delay.
A conceptual illustration created to explain equipment and application locations. It is not an actual product photograph, installation photograph or piping/wiring design.
Scroll horizontally to see the complete flow.
The fluid-sampling branch and electrical measurement signal are shown separately. Review aseptic connections, dead volume, analytical delay, and sensor calibration together.
These conceptual views explain flow direction. Actual piping, wiring and physical flow rates require a separate design.
Define the intended use and conditions to identify the required role of each item.
Determine what to measure and which process decision the result will support.
Review wetted components, aseptic connections, dead volume, and sensor location.
Record sampling time, analysis delay, and calibration history, and compare results.
Sampling results are affected by the container, sampling location, and time until analysis. pH and gas analysis, microbial testing, and pressure and flow monitoring each require configurations and calibration suited to their purpose.
Scroll horizontally to review all columns.
| Process objective | Step to review | Selection evidence |
|---|---|---|
| pH and dissolved gases | Sampling and analysis methods | Changes caused by air contact, bubbles, and analysis delays |
| Microbial and product analysis | Aseptic sampling | Container compatibility, representativeness, connections, and residual volume |
| Pressure and flow rate | Inline sensors | Range, accuracy, temperature compensation, signal, and wetted materials |
| Data quality | Calibration and comparative measurements | Differences from offline references, zero offset, and drift |
Compare actual operating conditions with supplier evidence and confirm the required performance and validation scope.
Cell metabolism and gas exchange can change measured values even after sampling.
Review whether liquid held in the piping represents the overall process and determine the flushing required.
Maintain linked records of sensor condition before and after sterilization, calibration values, operating time, and replacement criteria.
Differences in gas exchange, adsorption, and residual volume may affect analytical results, so a comparison is needed.
First check differences in temperature, location, sampling delay, calibration, and measurement principle.
These details help narrow the configuration and the evidence to review.
May we use Google Analytics, Google Ads and ChatGPT Ads to measure visits and completed enquiries? Learn more