
Define the purpose
Decide whether the purpose is resource assessment, performance monitoring, or comparison of energy generation.
Measure the solar resource on a horizontal surface separately from the light incident on the module plane.
Review selection pointsDiscuss this applicationFollow light, sensor measurements and data connections.
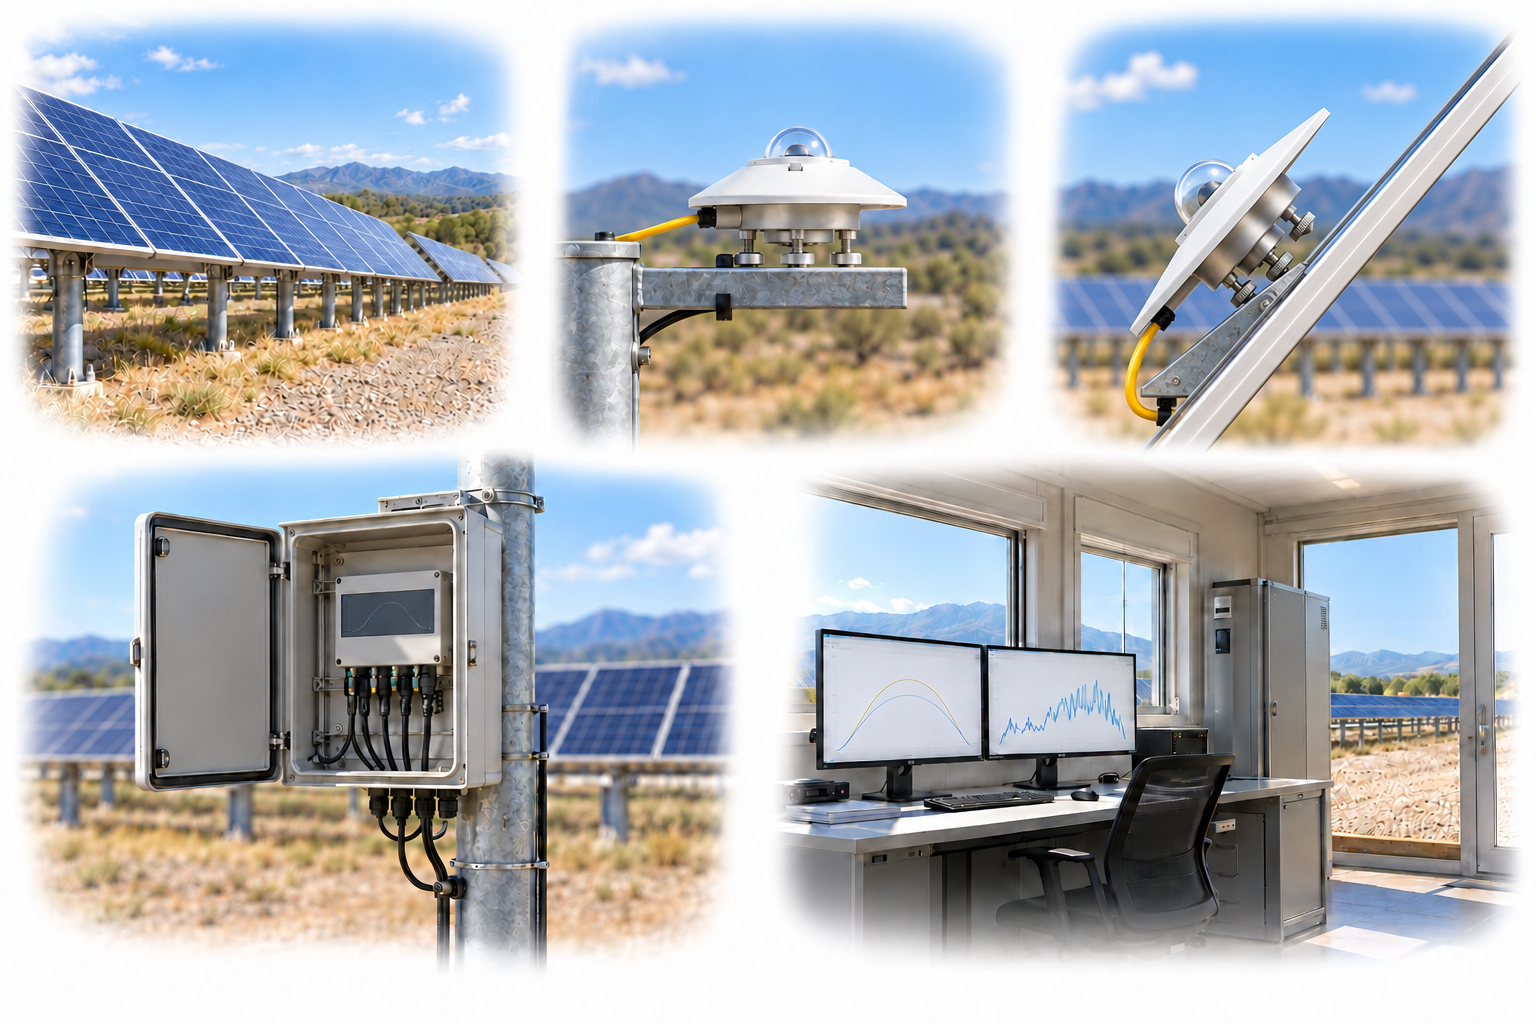
GHI remains horizontal; POA follows the module orientation. A tracker-mounted POA sensor rotates with the array.
A conceptual illustration created to explain equipment and application locations. It is not an actual product photograph, installation photograph or piping/wiring design.
Scroll horizontally to see the complete flow.
Yellow lines show incoming light; blue dashed lines show measurement signals. Align the POA sensor with module tilt and azimuth or tracking motion.
These conceptual views explain flow direction. Actual piping, wiring and physical flow rates require a separate design.
Define the intended use and conditions to identify the required role of each item.
Decide whether the purpose is resource assessment, performance monitoring, or comparison of energy generation.
Review the measurement plane, shading, field of view, and the performance characteristics of the pyranometer.
Check level, tilt, and azimuth, and plan calibration, cleaning, and data checks.
GHI is global horizontal irradiance; POA is the irradiance incident on a plane aligned with the modules. Even at the same power plant, the measurement purposes differ, so distinguish the sensor mounting angles and the way the data are interpreted.
Scroll horizontally to review all columns.
| Measurement objective | Item to review | Selection evidence |
|---|---|---|
| Horizontal solar resource | GHI | Horizontal installation, view of the sky, and shading from the surroundings |
| Module input | POA | Match the module tilt and azimuth; account for the rotation relationship in tracking systems |
| Sensor performance | Measurement principle and uncertainty | Directional response, temperature response, zero offset, and response time |
| Recording integration | Data logger and SCADA | Match output, power supply, sampling, timestamps, and units |
Review sensor suitability against the objective, installation environment, calibration evidence, system configuration and supplier specifications.
The classification of a pyranometer alone does not establish that the entire power plant monitoring system meets a particular class.
Check seasonal shading from masts, cables, and trees, as well as soiling and condensation on the dome.
Maintenance records must be linked to changes in the data to support interpretation of long-term performance.
GHI differs from the irradiance input on a tilted plane, so a transposition model or POA measurement is needed. Check that the uncertainty and input values are appropriate for the purpose.
The former expresses instantaneous radiant energy flux per unit area, or irradiance; the latter expresses energy per unit area accumulated over a specified time, or irradiation. When integrating the data, check the time intervals and any missing data.
These details help narrow the configuration and the evidence to review.
Confirm model suitability and supply scope through a technical review. Use each card to make an enquiry or review official manufacturer information.
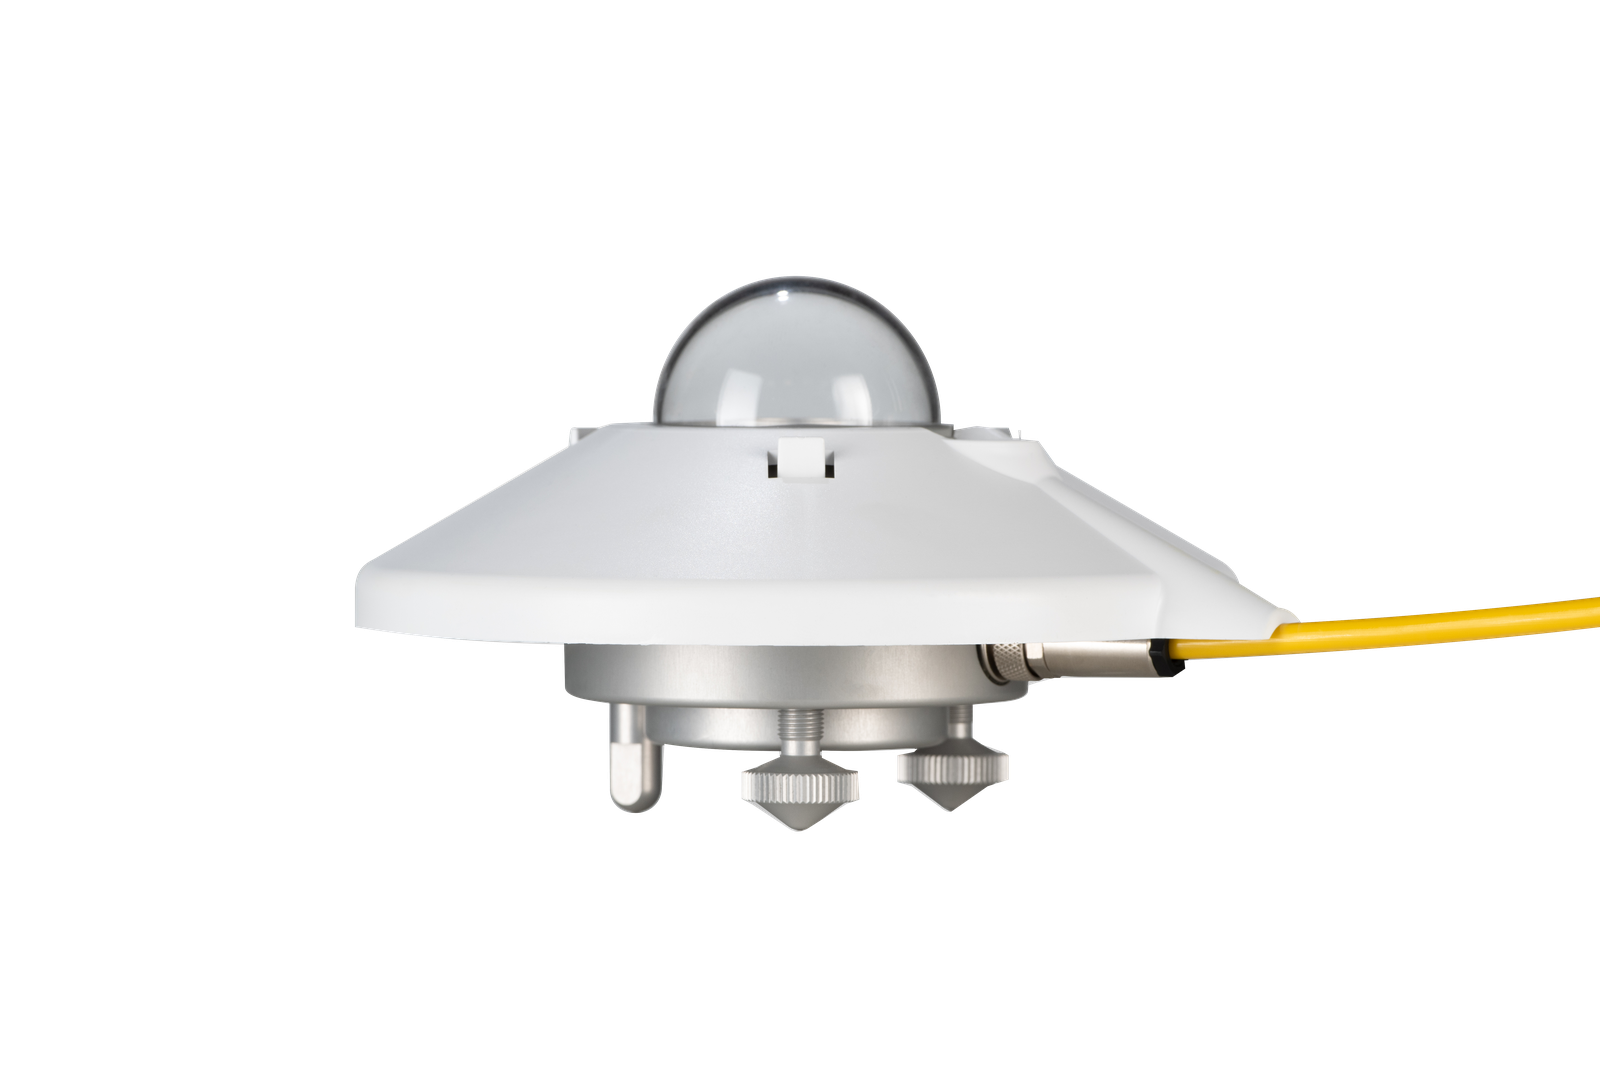
Class A pyranometer for digital solar irradiance measurement.
Enquire about this productOfficial manufacturer product information ↗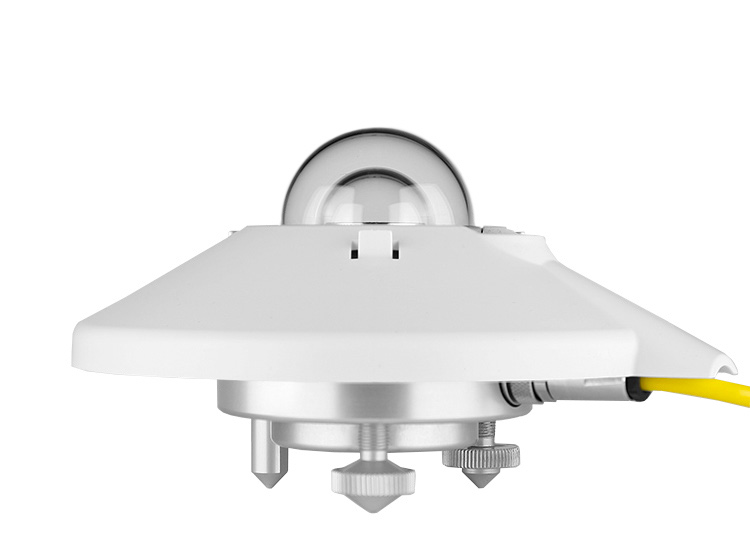
Class A pyranometer with analog output.
Enquire about this productOfficial manufacturer product information ↗Product photographs and manufacturer images use permitted official materials and source links. Original explanatory schematics are identified separately from actual product photographs.
Use this technical note when comparing instruments for GHI, POA and DNI measurement.
May we use Google Analytics, Google Ads and ChatGPT Ads to measure visits and completed enquiries? Learn more