
Characterize the feed
Review protein concentration, aggregates, impurities, and the effects of preceding process steps.
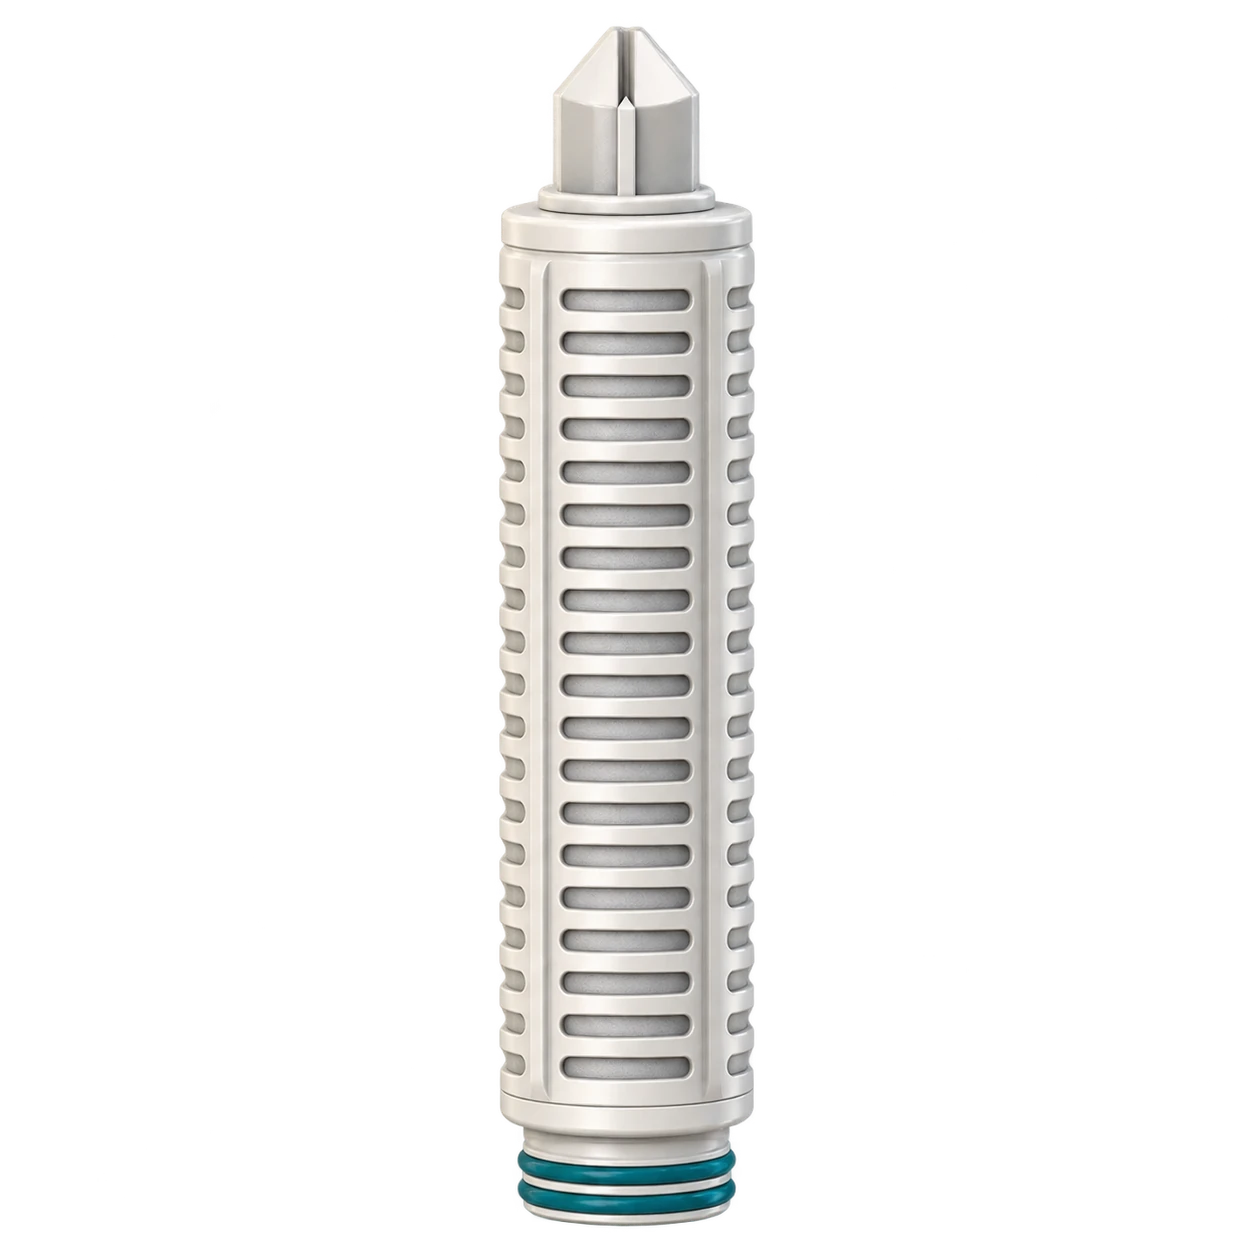
Clearly distinguish the roles of virus-removal filters and the pretreatment filters that protect them.
Review selection pointsDiscuss this applicationReview product locations and fluid paths.
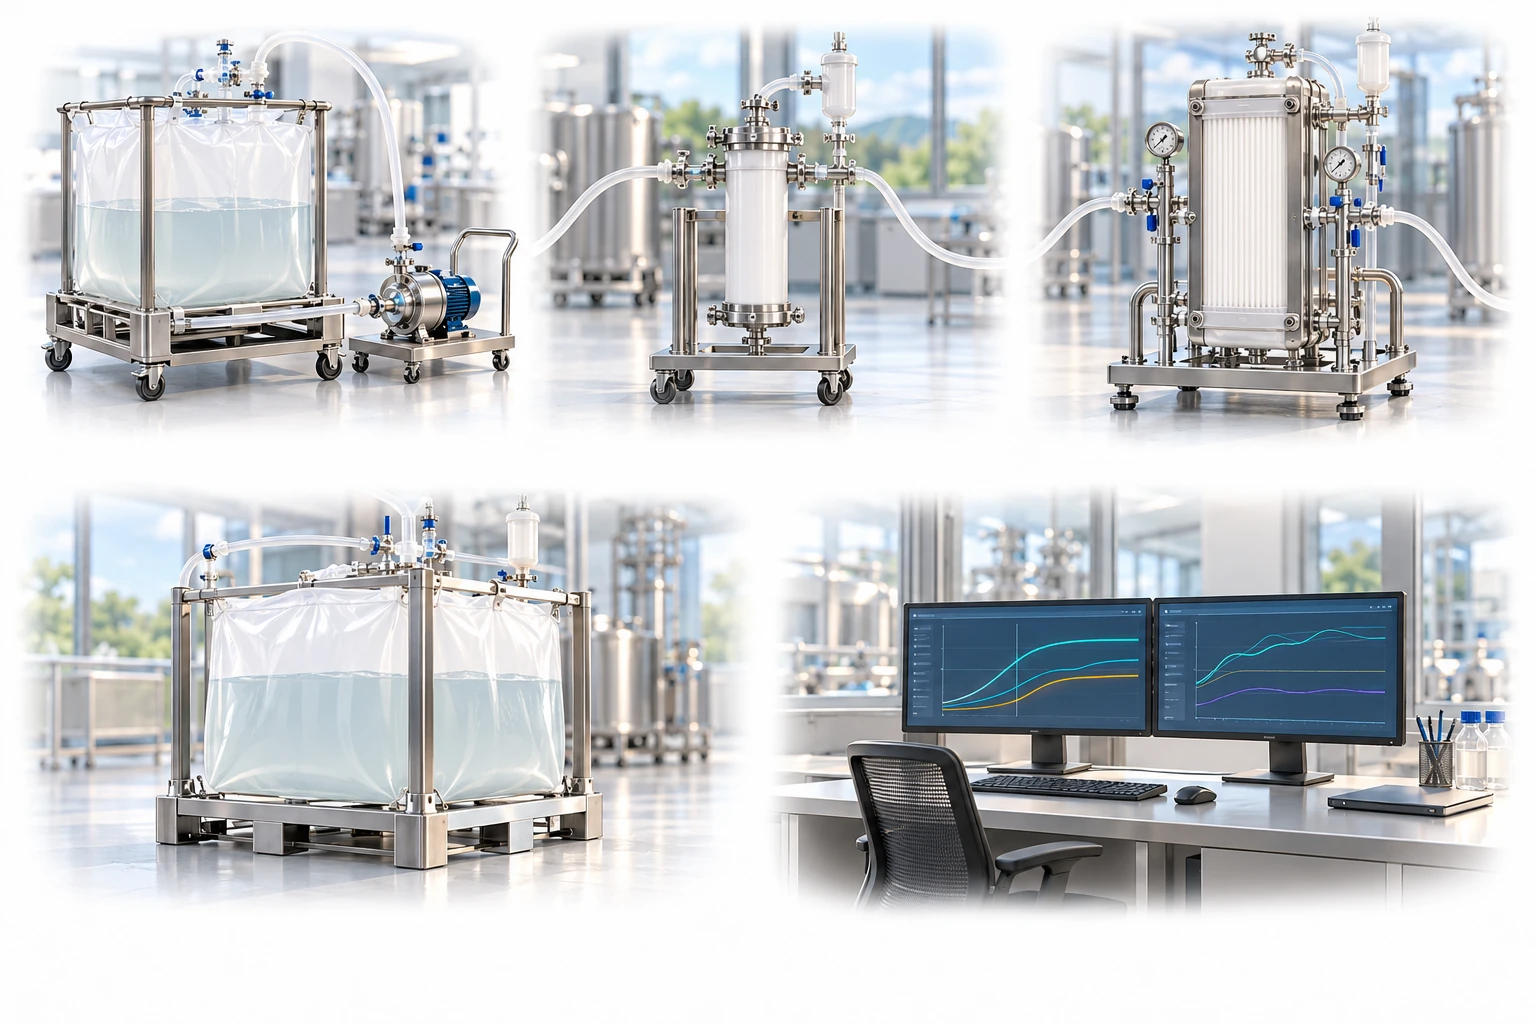
Distinguish protective prefiltration from dedicated virus removal. Do not apply this protein-process example universally to viral vectors.
A conceptual illustration created to explain equipment and application locations. It is not an actual product photograph, installation photograph or piping/wiring design.
Scroll horizontally to see the complete flow.
Prefiltration does not replace the virus-removal membrane. This diagram describes removing viruses as impurities, which is distinct from recovering a viral-vector product.
These conceptual views explain flow direction. Actual piping, wiring and physical flow rates require a separate design.
Define the intended use and conditions to identify the required role of each item.
Review protein concentration, aggregates, impurities, and the effects of preceding process steps.
Compare virus filter capacity and product losses with and without pretreatment.
Review removal performance under the relevant process conditions, process interruptions, and integrity acceptance criteria.
Viral safety is evaluated through a combination of raw material controls and multiple removal and inactivation steps. Pretreatment aims to reduce aggregate and particle loads to stabilize downstream capacity; it does not automatically imply that pretreatment itself removes viruses.
Scroll horizontally to review all columns.
| Process objective | Step to review | Selection evidence |
|---|---|---|
| Upstream aggregates | Protective pretreatment | Aggregate and particle reduction, and target product adsorption |
| Virus removal | Dedicated virus filters | Model viruses, process conditions, and validation strategy |
| Capacity stabilization | Loading, pressure, and time | Protein concentration, flux decline, and effects of pressure interruptions |
| Batch completion | Recovery and testing | Flushing losses, integrity testing, and record traceability |
These examples start the application review. Pore size or nominal rating alone does not establish suitability or retention; confirm with the actual process fluid and supplier evidence.
Do not directly apply results obtained with other products, buffers, or viruses.
Review the effects of actual scenarios such as stopping and restarting, low pressure, and maximum processing time.
Even if pretreatment adds cost, it may reduce dedicated filter area or product losses. Make the assessment on the basis of total batch cost.
It cannot be considered equivalent to a dedicated virus-removal filter. Clearly distinguish their intended purposes and validation data.
Compare capacity, aggregates, pressure trends, and product recovery using the same feed and downstream conditions.
These details help narrow the configuration and the evidence to review.
May we use Google Analytics, Google Ads and ChatGPT Ads to measure visits and completed enquiries? Learn more