
Create a signal list
Document each sensor’s output, power supply, address, format, and units.
Turn connected sensors into data that can be interpreted.
Review selection pointsDiscuss this applicationFollow light, sensor measurements and data connections.
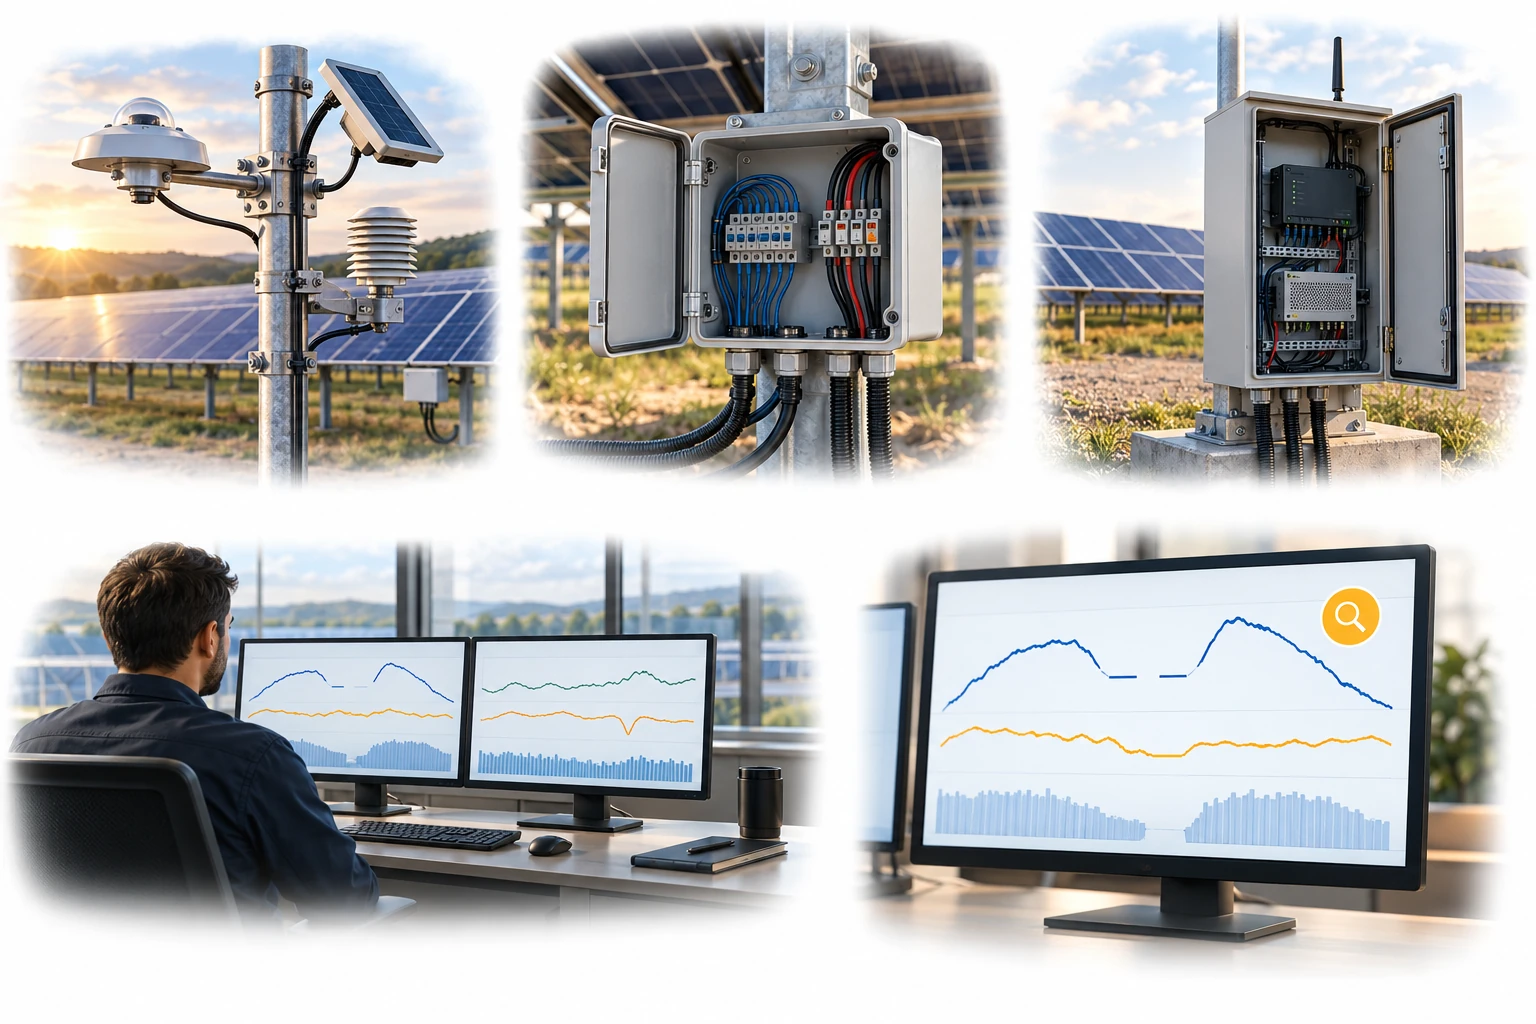
Signal wiring is separate from array power cables. Missing records are retained as a quality state rather than replaced with zero.
A conceptual illustration created to explain equipment and application locations. It is not an actual product photograph, installation photograph or piping/wiring design.
Scroll horizontally to see the complete flow.
Signal-line directions indicate data transfer. Design sensor power, grounding, termination resistors, and actual communication wiring according to manufacturer specifications.
These conceptual views explain flow direction. Actual piping, wiring and physical flow rates require a separate design.
Define the intended use and conditions to identify the required role of each item.
Document each sensor’s output, power supply, address, format, and units.
Configure sampling, averaging, integration, time synchronization, and recovery from faults.
Identify out-of-range readings, stuck values, missing data, and timestamp differences, and account for them in performance analysis.
A working sensor communication connection does not establish that the data are correct. Define units, timestamps, addresses, scaling factors, and missing-data handling so that irradiance, weather, and generation data use the same reference conventions.
Scroll horizontally to review all columns.
| Measurement objective | Item to review | Selection evidence |
|---|---|---|
| Digital communications | For example: RS-485 / Modbus | Address, baud rate, parity, registers, scaling factors, and byte order |
| Analog signals | Voltage / current input | Input range, resolution, conversion equation, grounding, and cables |
| Time handling | Timestamps, intervals, and integration | UTC or local time, sampling and averaging intervals, and missing-data handling |
| Quality status | Flags and history | Identification of sensor faults, cleaning, calibration, and abnormal values |
Review sensor suitability against the objective, installation environment, calibration evidence, system configuration and supplier specifications.
Preserve sensitivity values, correction equations, and revision history so that the data can be reviewed again.
A communication fault differs from a genuine zero reading at night. Distinguish them with separate quality status indicators.
Different time zones or averaging intervals for irradiance and generation data can distort performance indicators.
In addition to the physical connection, power supply, addresses, communication settings, and register formats must be matched.
A stuck value may indicate a sensor or communication fault. Check the rate of change and consistency with other sensors.
These details help narrow the configuration and the evidence to review.
Confirm model suitability and supply scope through a technical review. Use each card to make an enquiry or review official manufacturer information.
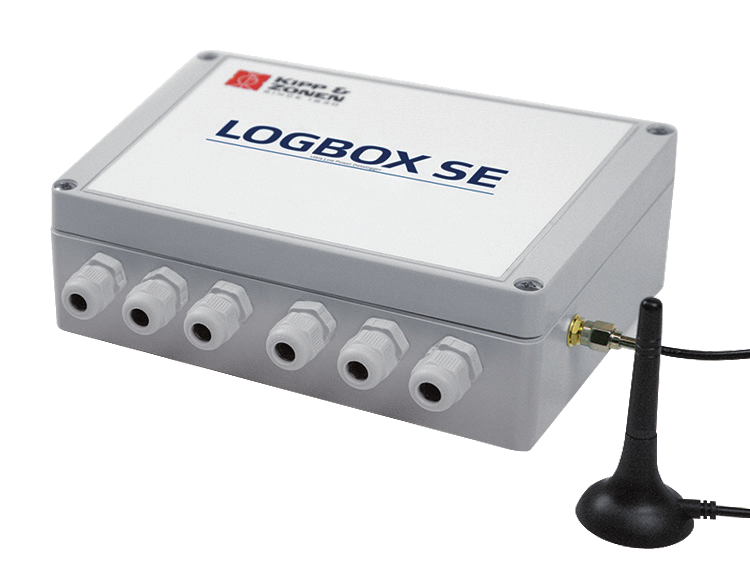
A weatherproof data logger for analog, digital and Modbus measurement signals. Confirm sensor inputs, power and communications against manufacturer documentation.
Enquire about this productOfficial manufacturer product information ↗Product photographs and manufacturer images use permitted official materials and source links. Original explanatory schematics are identified separately from actual product photographs.
Tell us which tasks you need and who currently handles them. Responsibilities, included work and costs are confirmed individually.
May we use Google Analytics, Google Ads and ChatGPT Ads to measure visits and completed enquiries? Learn more